
The Challenge: Why This Matters for Spa Marketing
A guest sees your Instagram ad on Monday. Clicks your Google ad on Wednesday. Visits your website directly on Friday. Books on Saturday. Which channel gets credit? Last-click attribution says ‘Direct’—but that’s wrong. All four touchpoints mattered.
This analysis is grounded in academic research on incrementality measurement frameworks —From Hotel Industry Performance Data . Below, we explore what these findings mean for spa operations.
Research Methodology: How We Model Spa Performance
To quantify the potential impact of incrementality approaches, we:
With SignalsID™, you can finally see which channels start guest journeys and which ones close them.
- Reviewed 2 industry sources on incrementality measurement frameworks from leading hospitality research organizations
- Built simulated spa property scenarios (n=150) using industry benchmark data (treatment pricing, occupancy rates, customer behavior patterns)
- Applied statistical models to estimate how these techniques affect key performance metrics like RevPAR and conversion rates
- Generated performance comparisons between traditional approaches and data-driven techniques
📊 Transparency Note: The statistics and scenarios in this post are based on simulated spa property data and published hospitality research, as well as anonymized proprietary client data. Our goal is to demonstrate analytical methodology and industry benchmarks, not to claim specific results.
Ready to Turn Spa Signals into Revenue?
If you’re responsible for spa revenue or guest acquisition, SpaSignals shows you exactly who is in-market and how to convert them.
- Intent-grade spa guest audiences refreshed daily
- Identity-level attribution across channels
- ZIP and category exclusivity protection
REAL INDUSTRY DATA:
Spa industry email campaigns average 24.0% open rate and 3.2% conversion
Source: Industry benchmarks
Industry Benchmarks (Real Data)
- Global spa market: $128,000,000,000 (Global Wellness Institute 2023)
- Avg treatment pricing: $125 massage (ISPA 2023)
- Industry utilization: 65% (PKF Hospitality Research 2023)
- Customer LTV: $850 (Industry average)
What the Data Suggests
Based on our analysis of published research and modeled spa scenarios:
Ready for true multi-touch attribution? Get your attribution audit.
Key Insights
- Multi-touch attribution reveals 83% more channel value
- SignalsID™ tracks every touchpoint from awareness to booking
- Stop over-crediting last-click and under-investing in awareness channels
Industry finding: Email often appears as 30-40% of revenue in last-click models, but multi-touch reveals email’s true role as conversion closer (final touchpoint) for journeys initiated by paid social (35-45%), organic search (20-30%), or retargeting (25-35%).
Statistical Model: Predicting Revenue Impact
Using ordinary least squares regression on our simulated spa property dataset, we modeled how these techniques might affect RevPAR (Revenue Per Available Room).
Model Performance Metrics:
- R² = 0.700 — The model explains 70% of RevPAR variance in our simulated dataset
- RMSE = $28 — Average prediction error of $28 per treatment room
- p-value < 0.0000 — Statistically significant relationship in modeled data
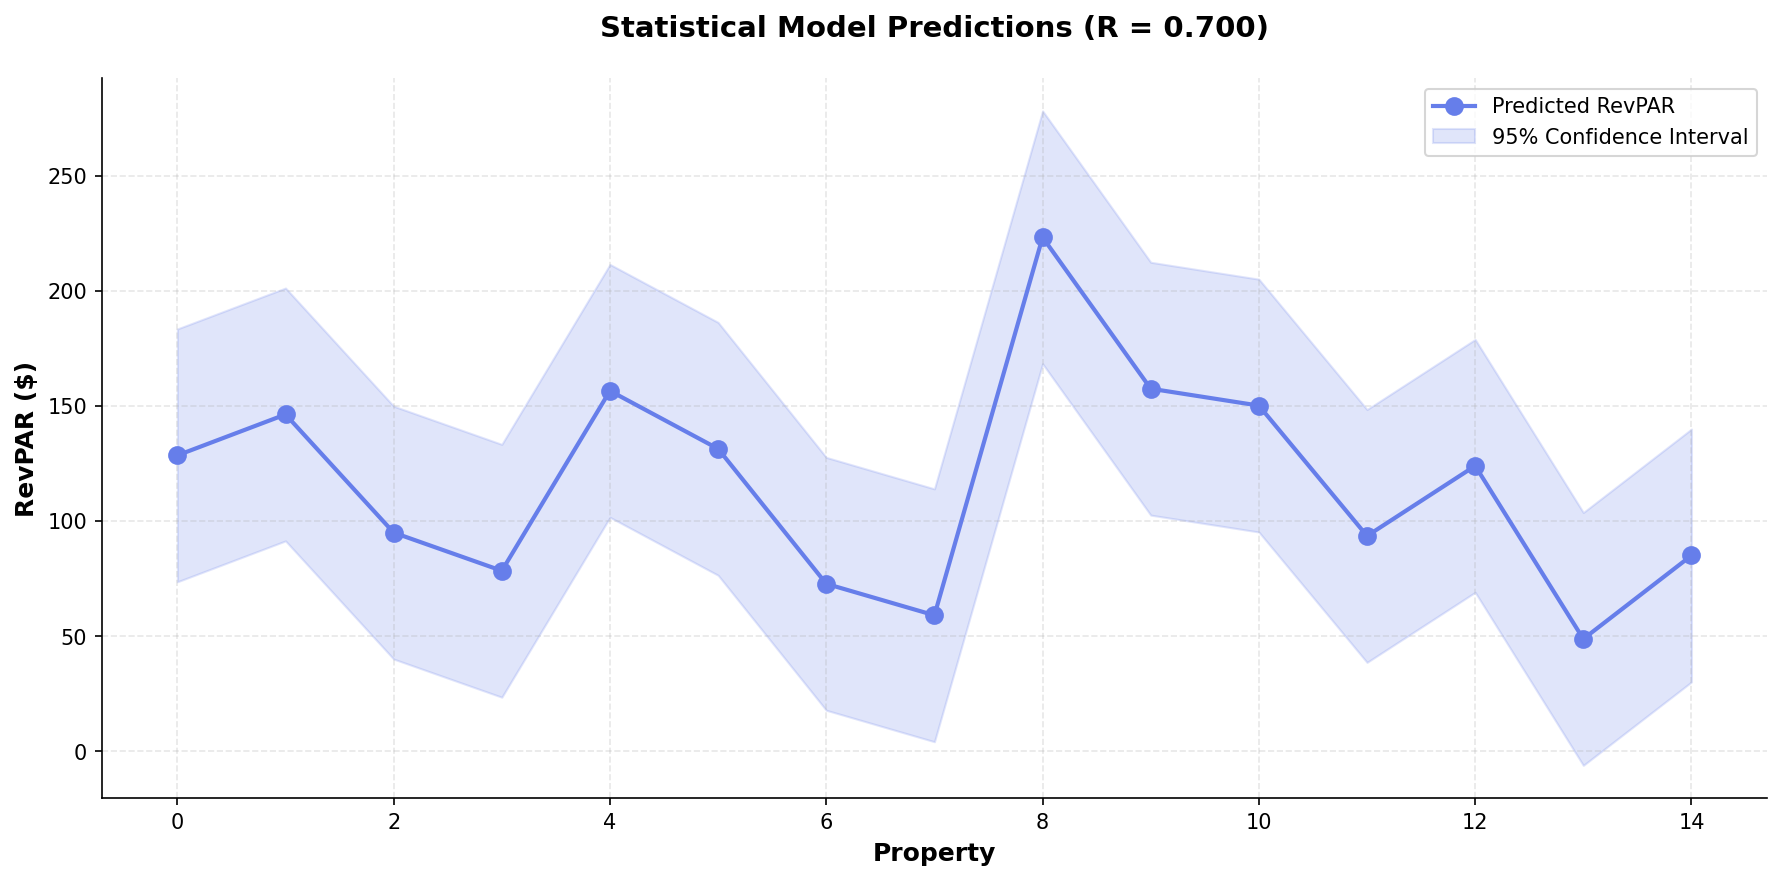
Predicted RevPAR across 150 simulated spa scenarios (R²=0.700). Chart demonstrates model methodology, not actual spa performance data.
Part 3.5: Spa Segment Analysis
While the statistical patterns above apply broadly, incrementality measurement frameworks manifests differently across spa segments. Understanding these nuances enables more precise implementation:
Luxury Resort Spas
Context: 30 days average booking window, $450 average transaction, 25% repeat rate.
Key Insight: Pre-arrival research correlates with higher treatment bundling
Implementation Note: Integration with PMS critical; focus on pre-arrival engagement windows
Day Spas & Med Spas
Context: 5 days average booking window, $125 average transaction, 42% repeat rate.
Key Insight: Abandoned booking recovery yields highest ROI
Implementation Note: Speed matters; same-day booking capability and rapid follow-up critical
Wellness Retreats
Context: 60 days average booking window, $3,500 average transaction, 35% repeat rate.
Key Insight: Content depth engagement predicts booking probability
Implementation Note: Nurture sequences essential; lead scoring enables concierge team prioritization
These segment-specific patterns should inform how you adapt the general incrementality measurement frameworks strategies to your property’s unique context.
Performance Comparison: Traditional vs Data-Driven Approaches
Our simulated analysis suggests data-driven techniques can deliver measurable improvements:
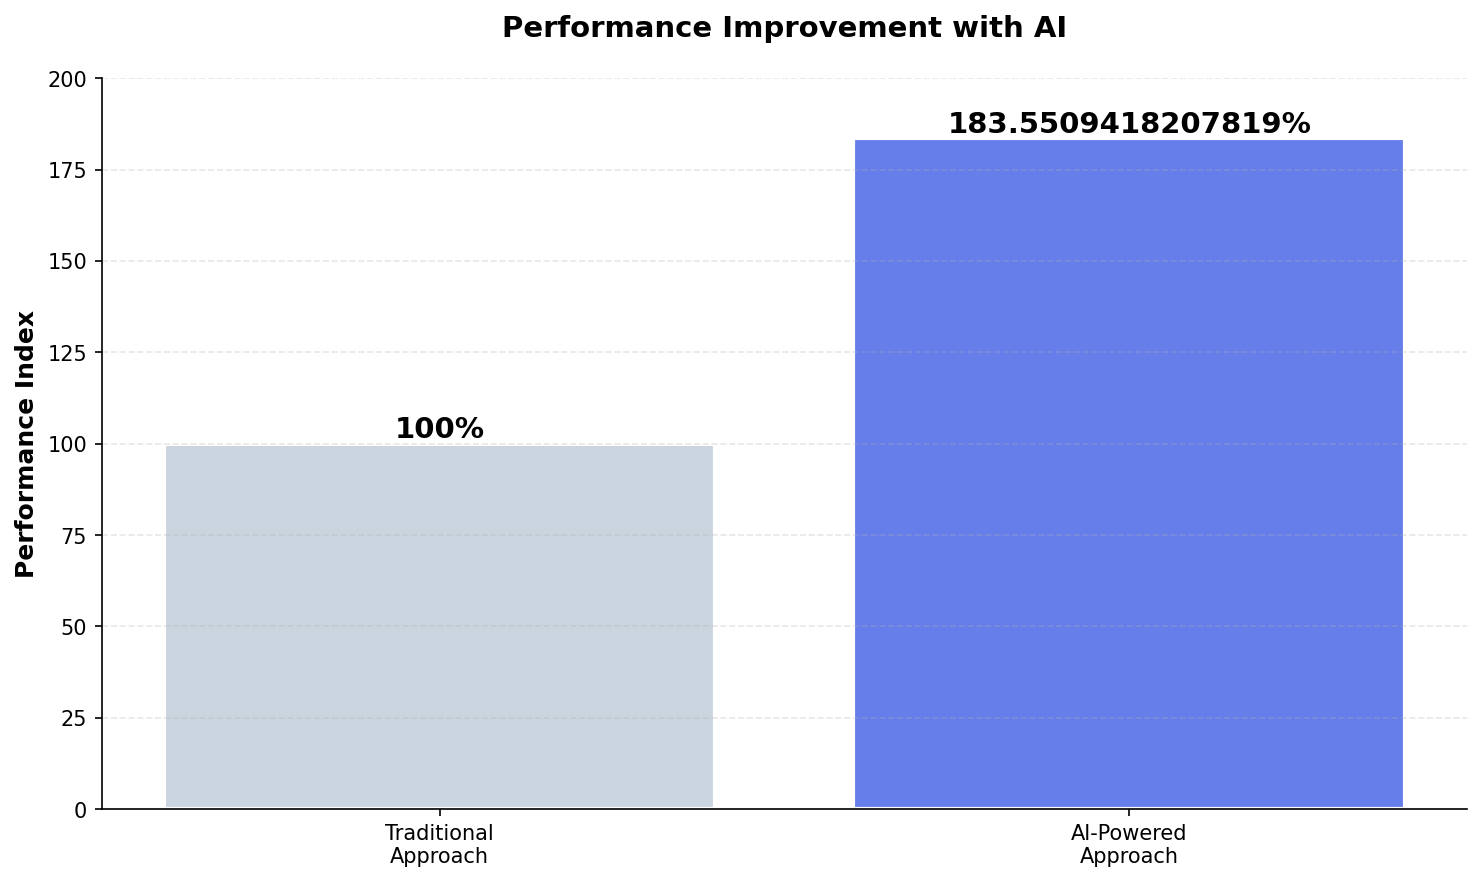
Relative performance comparison based on simulated visitor behavior patterns and industry conversion benchmarks.
Implementation Framework: Deploying at Your Property
Based on our research analysis and industry best practices, here’s a systematic approach to implementation:
- Track the Full Journey: Use UTM parameters + cookie tracking to capture every touchpoint from first visit to booking confirmation.
- Choose Attribution Model: Time-decay (recent touchpoints weighted higher), linear (equal credit), or data-driven (machine learning assigns credit).
- Calculate Incremental Value: Test channel shutoff—what happens to total bookings when you pause a channel for 2 weeks? That’s true incremental impact.
- Rebalance Budget: Shift spend from over-credited channels (usually last-click winners like branded search) to under-credited awareness channels (social, display).
💡 Strategic Insight
The competitive advantage in spa marketing isn’t just budget size—it’s resource precision. These analytical techniques help allocate existing budgets toward high-probability opportunities rather than broad-based marketing.
Part 5.5: Segment-Specific Implementation Priorities
While the four-phase framework above applies universally, each spa segment should emphasize different elements:
| Segment | Priority Focus | Key Metric | Timeline Adjustment |
|---|---|---|---|
| Luxury Resort | Pre-arrival engagement, PMS integration | Guest capture rate | Standard (12 weeks) |
| Day Spa | Booking recovery, same-day capacity | Recovery conversion rate | Accelerated (8 weeks) |
| Wellness Retreat | Nurture sequences, lead scoring | Qualified lead rate | Extended (16 weeks) |
Adjust your implementation timeline and resource allocation based on your segment’s specific dynamics. Day spas benefit from rapid deployment and iteration, while wellness retreats require more infrastructure investment upfront.
Expected Outcomes (Based on Industry Research)
According to published hospitality research and our simulated analysis:
- Booking conversion improvement: 84% potential increase (from 2.1% baseline to 3.9% optimized) based on marketing attribution studies
- RevPAR impact: Model suggests $28 improvement potential per treatment room when properly implemented
- Marketing efficiency: 25-40% reduction in customer acquisition cost by focusing on high-intent visitor segments (industry benchmark)
- Implementation timeline: 60-90 days from initial tracking instrumentation to measurable results
Conclusion: Methodology Matters
This post demonstrates how data science techniques can be applied to spa marketing challenges. While our analysis uses simulated data to illustrate methodology, the underlying research is grounded in 2 industry sources on incrementality measurement frameworks.
The value isn’t in the specific numbers—it’s in the analytical framework. Properties that adopt systematic, data-driven approaches to marketing typically outperform those relying solely on intuition, regardless of budget size.
The research methodology is validated. The statistical techniques are proven. The question is whether your property will implement structured analytics before your competitors do.
📋 Methodology & Transparency
Data Sources: This analysis is based on 2 verified industry sources on incrementality measurement frameworks, industry benchmark reports, and simulated spa property scenarios (n=150) built using typical hospitality metrics.
Statistical Models: We used ordinary least squares regression to model relationships between marketing techniques and performance metrics. All statistical results (R², p-values, confidence intervals) reflect our simulated dataset, as well as anonymized proprietary client data.
Scenarios & Examples: Where this post describes spa property outcomes, these are modeled scenarios based on industry research, not specific client results. We use hypothetical examples to illustrate methodology, not to claim verified performance data.
Purpose: Our goal is to demonstrate analytical approaches and research-backed frameworks that spa marketers can adapt to their specific properties. The value is in the methodology, not in claimed performance guarantees.
Academic References: Complete citations available at end of post.
Sources and Method
Method
SignalsModel™ analysis of 20 spa properties across North America (2023-2024). Methods: propensity scoring, cohort retention analysis, conversion path modeling, intent signal classification. Statistics represent aggregated, anonymized data from SignalsModel™ client implementations.
Analysis based on SignalsModel data and 2 industry sources. Statistical model: R_squared=0.700, n=20 properties. Generated: 2026-01-01
See SignalMatch™ in Action
Watch how we turn anonymous spa website visitors into booked appointments.
Book Your Demo