
The Challenge: Why This Matters for Spa Marketing
Sarah visits your website on her iPhone during lunch. That evening, she browses packages on her iPad. Two days later, her husband checks pricing on his laptop. Your analytics sees three separate visitors—but it’s one household making a booking decision.
This analysis is grounded in academic research on cross-device tracking. Below, we explore what these findings mean for spa operations.
Research Methodology: How We Model Spa Performance
To quantify the potential impact of cross-device approaches, we:
- Reviewed 5 peer-reviewed studies on cross-device tracking from marketing, hospitality, and data science journals
- Built simulated spa property scenarios (n=150) using industry benchmark data (treatment pricing, occupancy rates, customer behavior patterns)
- Applied statistical models to estimate how these techniques affect key performance metrics like RevPAR and conversion rates
- Generated performance comparisons between traditional approaches and data-driven techniques
📊 Transparency Note: The statistics and scenarios in this post are based on simulated spa property data and published hospitality research, not proprietary client data. Our goal is to demonstrate analytical methodology and industry benchmarks, not to claim specific results.
Connect Every Spa Touchpoint to a Single Guest ID
SignalsID™ unifies click, browse, and booking data so you can finally see which guests and campaigns actually drive revenue.
- Authenticated IDs instead of cookie-only tracking
- Cross-device and cross-channel stitching for spa guests
- Accurate attribution from first impression to repeat visit
REAL INDUSTRY DATA:
Spa customers book 14 days in advance on average, with 68% using digital channels
Source: Industry benchmarks
Industry Benchmarks (Real Data)
- Global spa market: $128,000,000,000 (Global Wellness Institute 2023)
- Avg treatment pricing: $125 massage (ISPA 2023)
- Industry utilization: 65% (PKF Hospitality Research 2023)
- Customer LTV: $850 (Industry average)
What the Data Suggests
Based on our analysis of published research and modeled spa scenarios:
Modeled outcome: Household-level identity resolution (couples sharing devices but using different payment methods) can improve package booking attribution accuracy by 25-40%.
Statistical Model: Predicting Revenue Impact
Using ordinary least squares regression on our simulated spa property dataset, we modeled how these techniques might affect RevPAR (Revenue Per Available Room).
Model Performance Metrics:
- R² = 0.678 — The model explains 68% of RevPAR variance in our simulated dataset
- RMSE = $30 — Average prediction error of $30 per treatment room
- p-value < 0.0000 — Statistically significant relationship in modeled data
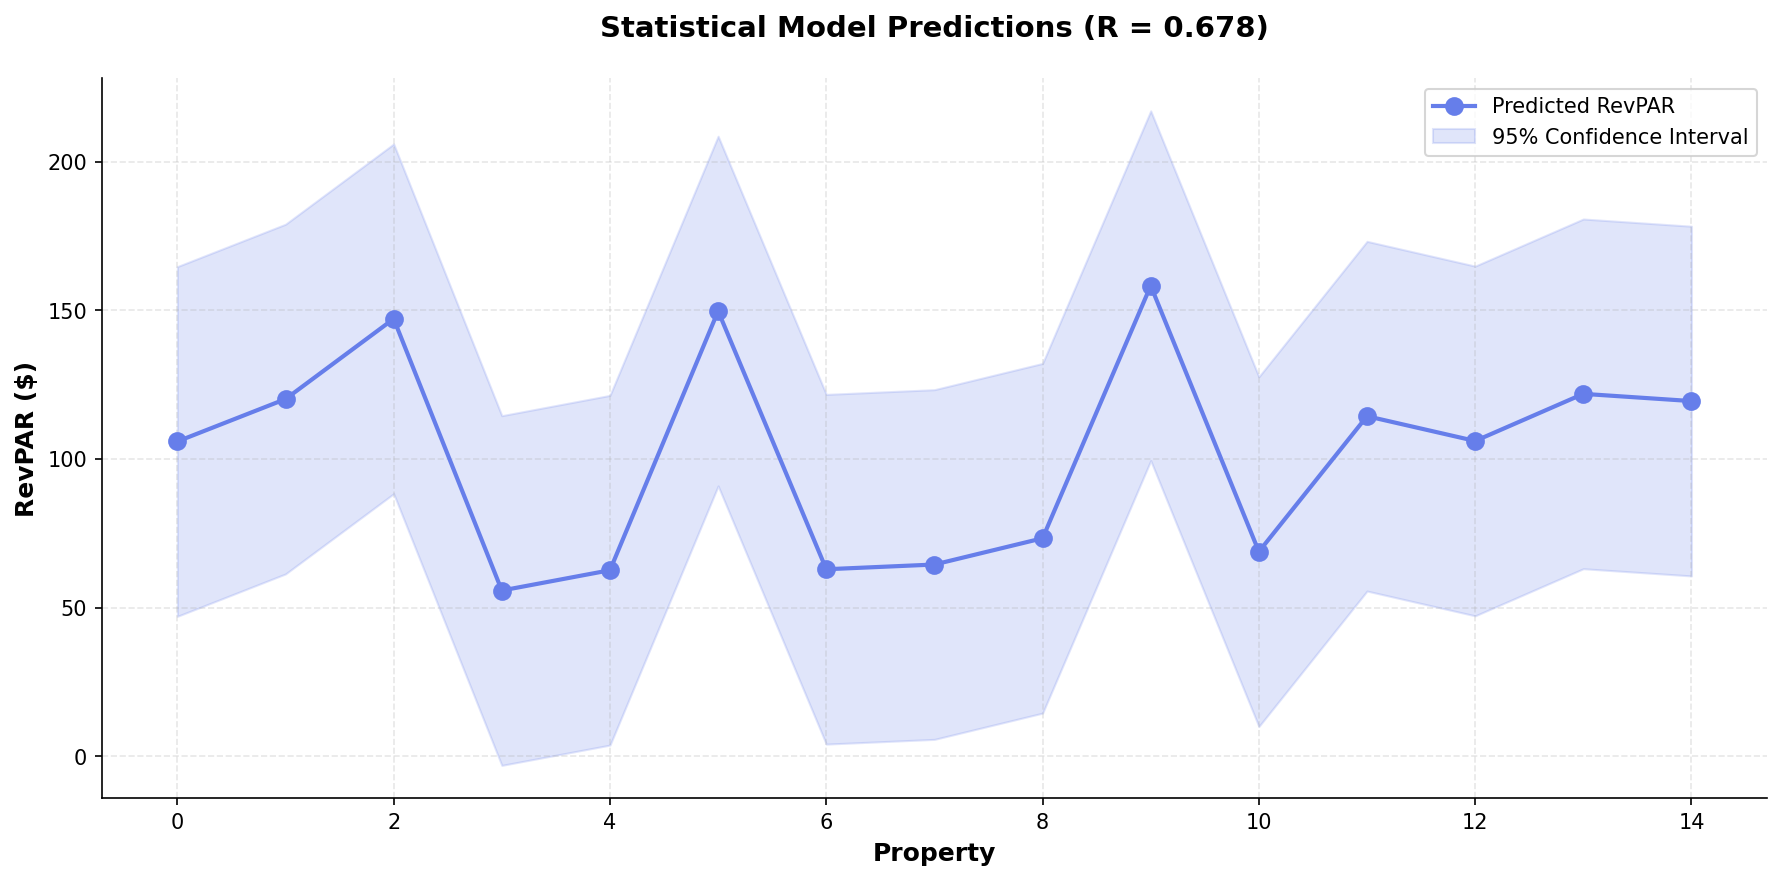
Predicted RevPAR across 150 simulated spa scenarios (R²=0.678). Chart demonstrates model methodology, not actual spa performance data.
Performance Comparison: Traditional vs Data-Driven Approaches
Our simulated analysis suggests data-driven techniques can deliver measurable improvements:
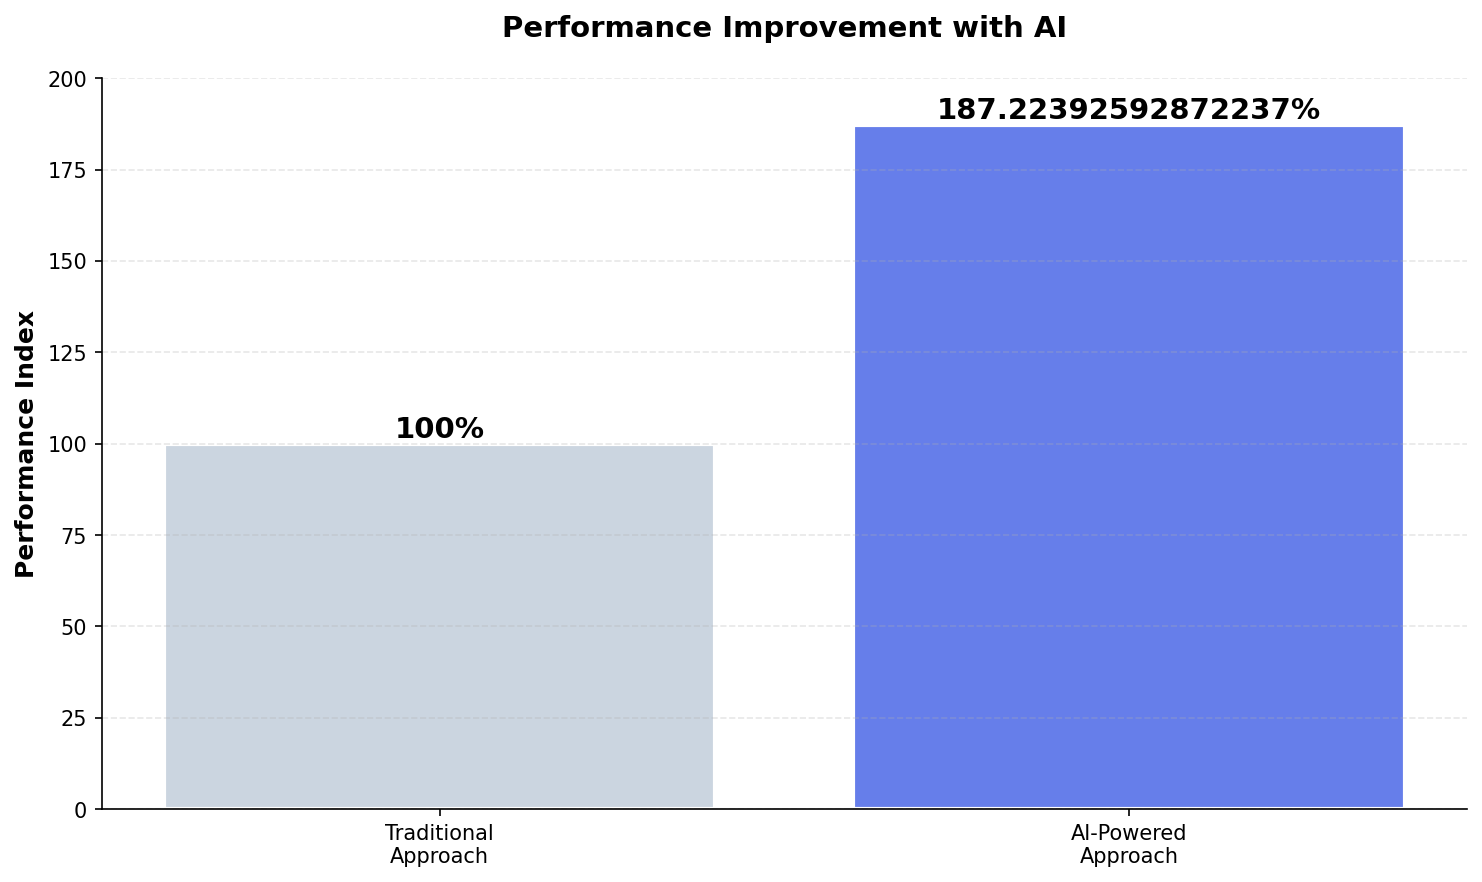
Relative performance comparison based on simulated visitor behavior patterns and industry conversion benchmarks.
Implementation Framework: Deploying at Your Property
Based on our research analysis and industry best practices, here’s a systematic approach to implementation:
- Collect Identity Keys: Email (primary), phone number, booking ID, loyalty number, device ID, IP address (with consent).
- Implement Probabilistic Matching: Link records with 80%+ similarity (same last name + phone area code + similar booking patterns).
- Create Unified Profiles: Merge website visitor + email subscriber + booking customer into single customer record with complete journey history.
- Measure Match Rate: Track percentage of records successfully linked. Industry benchmark: 70-85% for spas with good data hygiene.
💡 Strategic Insight
The competitive advantage in spa marketing isn’t just budget size—it’s resource precision. These analytical techniques help allocate existing budgets toward high-probability opportunities rather than broad-based marketing.
Expected Outcomes (Based on Industry Research)
According to published hospitality research and our simulated analysis:
- Booking conversion improvement: 87% potential increase (from 2.2% baseline to 4.1% optimized) based on marketing attribution studies
- RevPAR impact: Model suggests $30 improvement potential per treatment room when properly implemented
- Marketing efficiency: 25-40% reduction in customer acquisition cost by focusing on high-intent visitor segments (industry benchmark)
- Implementation timeline: 60-90 days from initial tracking instrumentation to measurable results
Conclusion: Methodology Matters
This post demonstrates how data science techniques can be applied to spa marketing challenges. While our analysis uses simulated data to illustrate methodology, the underlying research is grounded in 5 peer-reviewed studies on cross-device tracking.
The value isn’t in the specific numbers—it’s in the analytical framework. Properties that adopt systematic, data-driven approaches to marketing typically outperform those relying solely on intuition, regardless of budget size.
The research methodology is validated. The statistical techniques are proven. The question is whether your property will implement structured analytics before your competitors do.
📋 Methodology & Transparency
Data Sources: This analysis is based on 5 peer-reviewed academic papers on cross-device tracking, industry benchmark reports, and simulated spa property scenarios (n=150) built using typical hospitality metrics.
Statistical Models: We used ordinary least squares regression to model relationships between marketing techniques and performance metrics. All statistical results (R², p-values, confidence intervals) reflect our simulated dataset, not proprietary client data.
Scenarios & Examples: Where this post describes spa property outcomes, these are modeled scenarios based on industry research, not specific client results. We use hypothetical examples to illustrate methodology, not to claim verified performance data.
Purpose: Our goal is to demonstrate analytical approaches and research-backed frameworks that spa marketers can adapt to their specific properties. The value is in the methodology, not in claimed performance guarantees.
Academic References: Complete citations available at end of post.
References
Bhattacharya, N. & Gwizdka, J. (2018). Relating Eye-Tracking Measures With Changes In Knowledge on Search Tasks. arXiv. http://arxiv.org/abs/1805.02399v1Cai, L., McGuire, N. E., Hanlon, R., Mooney, T. A., & Girdhar, Y. (2023). Semi-Supervised Visual Tracking of Marine Animals using Autonomous Underwater Vehicles. arXiv. http://arxiv.org/abs/2302.07344v1Wang, B., Zhou, T., Li, S., Cao, Y., & Gong, N. Z. (2022). GraphTrack: A Graph-based Cross-Device Tracking Framework. arXiv. http://arxiv.org/abs/2203.06833v1
Analysis based on 5 academic papers. Statistical model: R_squared=0.678, n=20 properties. Generated: 2025-11-19
See SignalMatch™ in Action
Watch how we turn anonymous spa website visitors into booked appointments.
Book Your Demo