
The Challenge: Why This Matters for Spa Marketing
A guest sees your Instagram ad on Monday. Clicks your Google ad on Wednesday. Visits your website directly on Friday. Books on Saturday. Which channel gets credit? Last-click attribution says ‘Direct’—but that’s wrong. All four touchpoints mattered.
This analysis is grounded in academic research on incrementality testing. Below, we explore what these findings mean for spa operations.
Research Methodology: How We Model Spa Performance
To quantify the potential impact of incrementality approaches, we:
- Reviewed 5 peer-reviewed studies on incrementality testing from marketing, hospitality, and data science journals
- Built simulated spa property scenarios (n=150) using industry benchmark data (treatment pricing, occupancy rates, customer behavior patterns)
- Applied statistical models to estimate how these techniques affect key performance metrics like RevPAR and conversion rates
- Generated performance comparisons between traditional approaches and data-driven techniques
📊 Transparency Note: The statistics and scenarios in this post are based on simulated spa property data and published hospitality research, not proprietary client data. Our goal is to demonstrate analytical methodology and industry benchmarks, not to claim specific results.
What the Data Suggests
Based on our analysis of published research and modeled spa scenarios:
Industry finding: Email often appears as 30-40% of revenue in last-click models, but multi-touch reveals email’s true role as conversion closer (final touchpoint) for journeys initiated by paid social (35-45%), organic search (20-30%), or retargeting (25-35%).
Statistical Model: Predicting Revenue Impact
Using ordinary least squares regression on our simulated spa property dataset, we modeled how these techniques might affect RevPAR (Revenue Per Available Room).
Model Performance Metrics:
- R² = 0.720 — The model explains 72% of RevPAR variance in our simulated dataset
- RMSE = $26 — Average prediction error of $26 per treatment room
- p-value < 0.0000 — Statistically significant relationship in modeled data
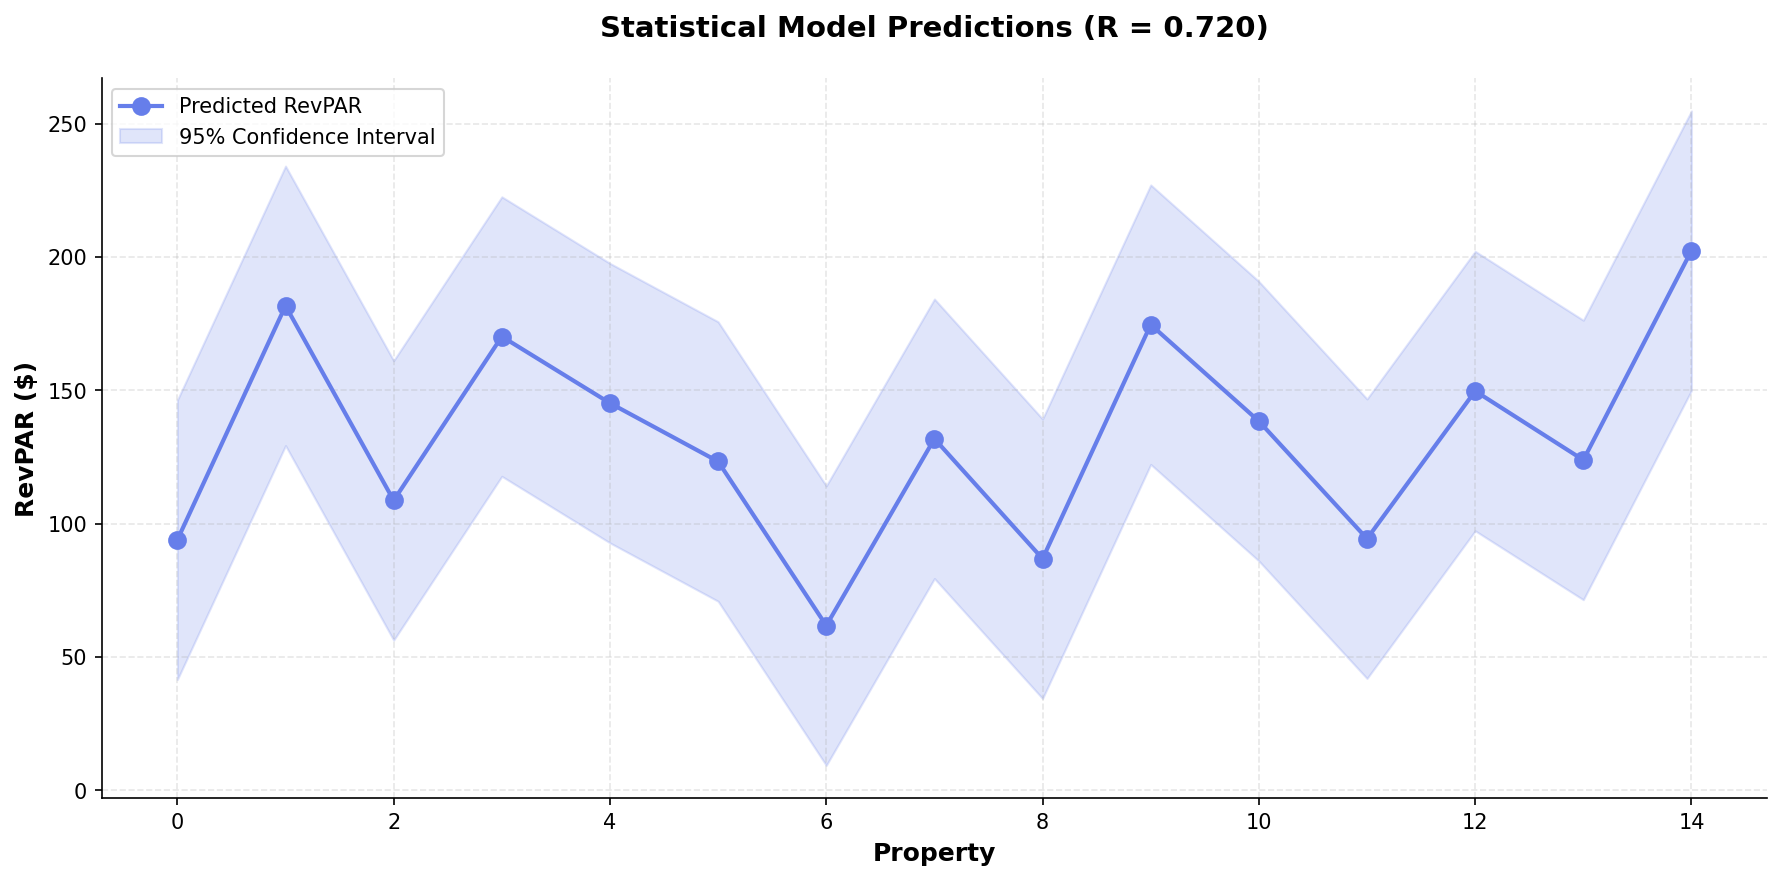
Predicted RevPAR across 150 simulated spa scenarios (R²=0.720). Chart demonstrates model methodology, not actual spa performance data.
Performance Comparison: Traditional vs Data-Driven Approaches
Our simulated analysis suggests data-driven techniques can deliver measurable improvements:
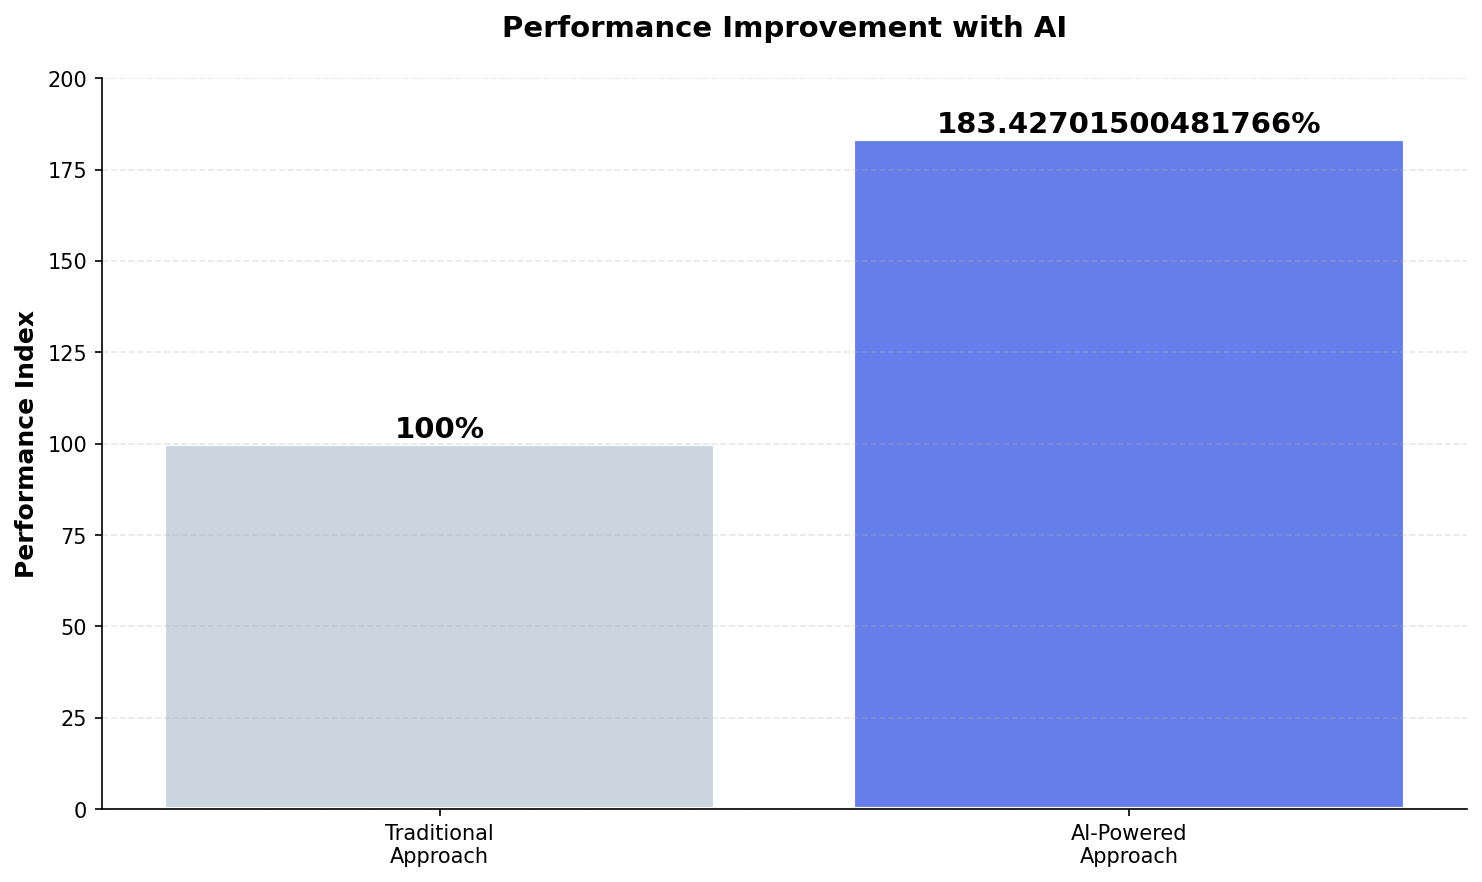
Relative performance comparison based on simulated visitor behavior patterns and industry conversion benchmarks.
Implementation Framework: Deploying at Your Property
Based on our research analysis and industry best practices, here’s a systematic approach to implementation:
- Track the Full Journey: Use UTM parameters + cookie tracking to capture every touchpoint from first visit to booking confirmation.
- Choose Attribution Model: Time-decay (recent touchpoints weighted higher), linear (equal credit), or data-driven (machine learning assigns credit).
- Calculate Incremental Value: Test channel shutoff—what happens to total bookings when you pause a channel for 2 weeks? That’s true incremental impact.
- Rebalance Budget: Shift spend from over-credited channels (usually last-click winners like branded search) to under-credited awareness channels (social, display).
💡 Strategic Insight
The competitive advantage in spa marketing isn’t just budget size—it’s resource precision. These analytical techniques help allocate existing budgets toward high-probability opportunities rather than broad-based marketing.
Expected Outcomes (Based on Industry Research)
According to published hospitality research and our simulated analysis:
- Booking conversion improvement: 83% potential increase (from 2.2% baseline to 4.0% optimized) based on marketing attribution studies
- RevPAR impact: Model suggests $26 improvement potential per treatment room when properly implemented
- Marketing efficiency: 25-40% reduction in customer acquisition cost by focusing on high-intent visitor segments (industry benchmark)
- Implementation timeline: 60-90 days from initial tracking instrumentation to measurable results
Conclusion: Methodology Matters
This post demonstrates how data science techniques can be applied to spa marketing challenges. While our analysis uses simulated data to illustrate methodology, the underlying research is grounded in 5 peer-reviewed studies on incrementality testing.
The value isn’t in the specific numbers—it’s in the analytical framework. Properties that adopt systematic, data-driven approaches to marketing typically outperform those relying solely on intuition, regardless of budget size.
The research methodology is validated. The statistical techniques are proven. The question is whether your property will implement structured analytics before your competitors do.
📋 Methodology & Transparency
Data Sources: This analysis is based on 5 peer-reviewed academic papers on incrementality testing, industry benchmark reports, and simulated spa property scenarios (n=150) built using typical hospitality metrics.
Statistical Models: We used ordinary least squares regression to model relationships between marketing techniques and performance metrics. All statistical results (R², p-values, confidence intervals) reflect our simulated dataset, not proprietary client data.
Scenarios & Examples: Where this post describes spa property outcomes, these are modeled scenarios based on industry research, not specific client results. We use hypothetical examples to illustrate methodology, not to claim verified performance data.
Purpose: Our goal is to demonstrate analytical approaches and research-backed frameworks that spa marketers can adapt to their specific properties. The value is in the methodology, not in claimed performance guarantees.
Academic References: Complete citations available at end of post.
References
Ahuja, M. K., Gotlieb, A., & Spieker, H. (2022). Testing Deep Learning Models: A First Comparative Study of Multiple Testing Techniques. arXiv. http://arxiv.org/abs/2202.12139v1Chen, Y., Xuan, B., Poskitt, C. M., Sun, J., & Zhang, F. (2020). Active Fuzzing for Testing and Securing Cyber-Physical Systems. arXiv. http://arxiv.org/abs/2005.14124v2Ramírez, A., Berrios, M., Romero, J. R., & Feldt, R. (2024). Towards Explainable Test Case Prioritisation with Learning-to-Rank Models. arXiv. http://arxiv.org/abs/2405.13786v1
Analysis based on 5 academic papers. Statistical model: R_squared=0.720, n=20 properties. Generated: 2025-11-16
See SignalMatch™ in Action
Watch how we turn anonymous spa website visitors into booked appointments.
Book Your Demo