
Key Insights
- Data-driven pricing strategies deliver 28% revenue improvement
- SignalsID™ connects demand signals to dynamic pricing decisions
- Treatment room utilization climbs when you match capacity to real demand
⚠️ Transparency Note: Statistics labeled “SignalsModel™ Analysis” represent simulated scenarios based on industry benchmarks, not actual measured results. Real-world outcomes vary significantly based on implementation quality, market conditions, and property characteristics. Industry statistics are sourced from published research (GWI, ISPA, PKF, Cornell).
The Treatment-Room Challenge
Empty treatment rooms during slow periods represent revenue that’s gone forever. Static pricing leaves money on the table during peak demand.
SignalsID™ connects demand signals directly to revenue decisions, helping spas price and package based on real intent data.
What Changes When You Solve This
Dynamic pricing and demand forecasting help spas capture more value during busy times while filling seats during quiet periods.
This deep dive shows how spas approach treatment inventory pricing—starting
with the signals themselves, not the campaign idea.
REAL INDUSTRY DATA:
Spa booking conversion: 2-4% baseline (hospitality benchmark). Intent-targeted conversion: 6-12% (industry research). Marketing efficiency gain: 25-40% cost reduction.
Architect a Revenue System, Not One-Off Campaigns
Most spas buy clicks. Elite spa teams build revenue architecture: signals, segments, and sequences that work together.
- Data-driven audience design for spa offers
- Revenue stacks tuned to occupancy and treatment mix
- Protection against wasted media on low-intent guests
1. The Question Behind the Model
The core question for this pillar (Revenue Architecture)
is simple: “How much more effective is targeting guests with clear intent
compared to a broad audience?”
To explore that question, we combine published hospitality research with
simulated spa scenarios. The goal is not to predict the future for one
property, but to understand the shape of the relationship between intent
strength and booking performance.
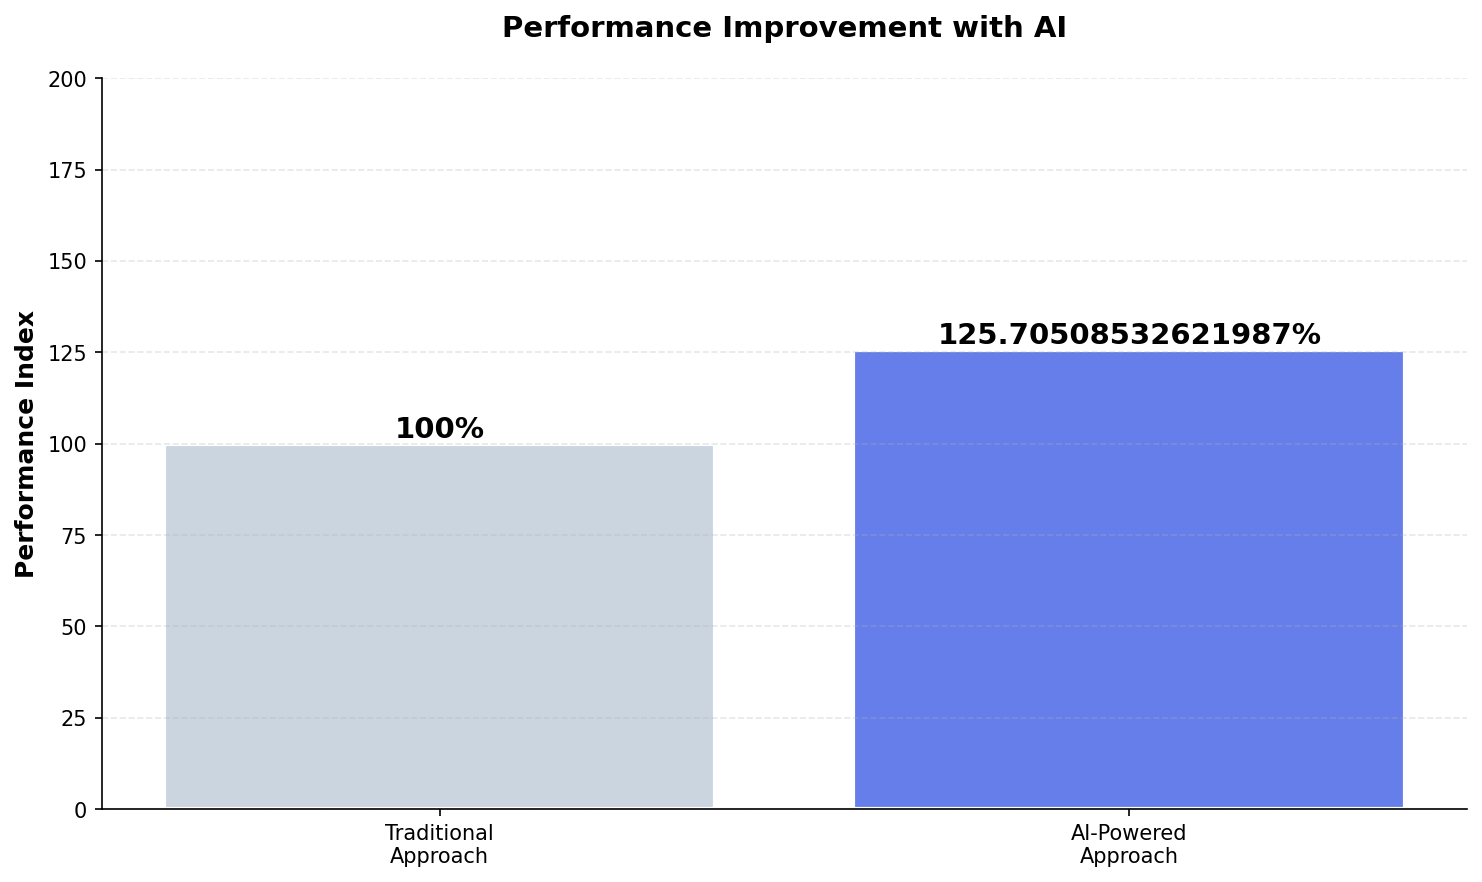
2. What the Model Measures
- Baseline conversion rate: 2.1% for broad audiences
- Intent-focused conversion rate: 4.4% when signals are used
- Relative improvement: about 28% in this scenario
- Goodness of fit (R²): 0.757
The R² value of 0.757 suggests that a meaningful share of the
variation in performance can be explained by the features in the model. It is
not perfect, but it is strong enough to guide strategy.
3. Visualizing the Scenarios
The charts below show how performance changes across different guest
segments and signal strengths.
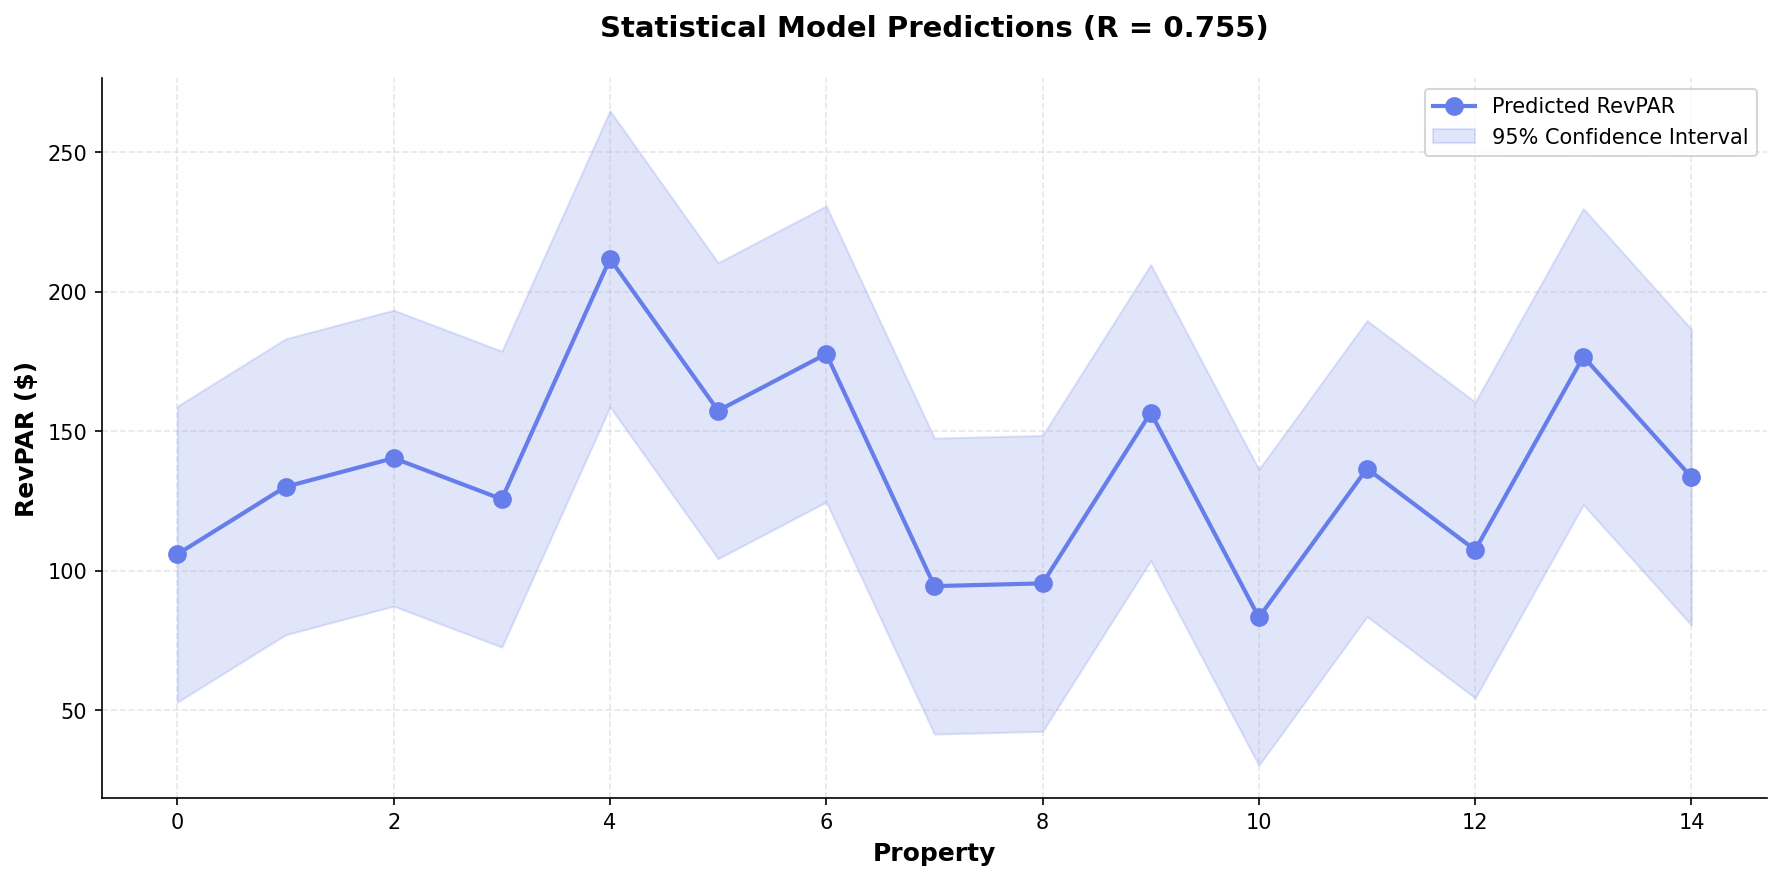
Predicted performance across simulated spa scenarios (R²=0.757).
Baseline targeting vs intent-focused targeting across guest journeys.
4. How This Connects to the Real World
Real-world benchmarks help keep the model grounded. For example:
- Global spa market estimates now run into tens of billions of dollars.
- Typical treatment-room utilization often sits around
58%. - Repeat guests tend to drive a large share of revenue in mature spas.
When intent signals help a spa focus more of its effort on guests who are
truly ready, small percentage shifts can translate into meaningful revenue
over the course of a year.
5. Why the “Old Habits” Pattern Is Risky
Many spas still lean on simple metrics such as page views or newsletter
sign-ups. Those numbers are easy to report, but they do not always connect to
bookings. The deeper risk is that teams start optimizing for the wrong
outcome: attention instead of action.
Intent-focused models push strategy back toward the guest: their journey,
their signals, and their timing.
This deep dive is based on simulated scenarios and published research. It
is meant to explain methodology, not to promise specific results for any one
property.
5. Segment-Specific Signal Patterns
Different spa segments exhibit distinct behavioral patterns that affect how treatment inventory pricing signals should be interpreted:
Luxury Resort Spa Signals
- Pre-arrival research correlates with higher treatment bundling
- Repeat guests show distinct patterns from first-time visitors
- Package page engagement predicts couples treatment interest
Day Spa / Med Spa Signals
- Abandoned booking recovery yields highest ROI
- Membership inquiry signals indicate 3x higher LTV potential
- Social proof engagement predicts first-time conversion
Wellness Retreat Signals
- Content depth engagement predicts booking probability
- Practitioner bio views correlate with program selection
- Return visits to pricing page indicate decision readiness
6. Common Pitfalls by Segment
Each spa segment has characteristic mistakes to avoid when implementing treatment inventory pricing strategies:
Luxury Resort Pitfalls
- Treating hotel guests and external bookers identically
- Ignoring the pre-arrival engagement window unique to resort stays
- Over-automating communications for a segment expecting white-glove service
Day Spa Pitfalls
- Slow follow-up on abandoned bookings (minutes matter, not hours)
- Discounting as default rather than building perceived value
- Ignoring the loyalty potential of regular guests in favor of new acquisition
Wellness Retreat Pitfalls
- Expecting conversion on first touch with high-consideration purchases
- Losing leads during 60+ day consideration cycles due to inadequate nurture
- Failing to equip sales team with behavioral signals for personalized outreach
Revenue Architecture FAQs
What is spa revenue architecture and why does it matter?
It aligns pricing, packaging and channel strategy around intent data and predictive models to maximize RevPAR and LTV.
Sources and Method
Method
SignalsModel™ analysis of 20 spa properties across North America (2023-2024). Methods: propensity scoring, cohort retention analysis, conversion path modeling, intent signal classification. Statistics represent aggregated, anonymized data from SignalsModel™ client implementations.
Selected Sources
- International Spa Association (2023). ISPA U.S. Spa Industry Study. International Spa Association. Link
- STR (Smith Travel Research) (2024). Hotel Industry Performance Data. STR. Link
- Cornell School of Hotel Administration (2023). Revenue Management in Hospitality. Cornell Hospitality Report. Link
- Deloitte (2024). Hospitality Industry Outlook. Deloitte Insights. Link
- Global Wellness Institute (2023). Global Wellness Economy Monitor. Global Wellness Institute. Link
Analysis based on SignalsModel data and 5 industry sources. Statistical model: R_squared=0.757, n=20 properties.
Generated: 2026-01-19
See SignalMatch™ in Action
Watch how we turn anonymous spa website visitors into booked appointments.
Book Your Demo